The QC Lab Benchmarking helps to assess your Operational Excellence (OPEX) Performance and Maturity in the Quality Control (QC) Lab. With the industry-tested holistic approach of the St.Gallen OPEX Benchmarking we ensure a meaningful assessment of your QC Lab. To suit the lab environment we jointly developed with the industry Key Performance Indicators (KPIs) taking into account lab specific characteristics.
The benchmarking was developed in 2016 together with leading pharmaceutical companies to ensure capturing the right scope of OPEX assessment in your QC Lab. In 2018 the benchmarking database already reached more than 50 QC Labs from all around the world that can be compared. If you want to participate in this benchmarking please contact us.
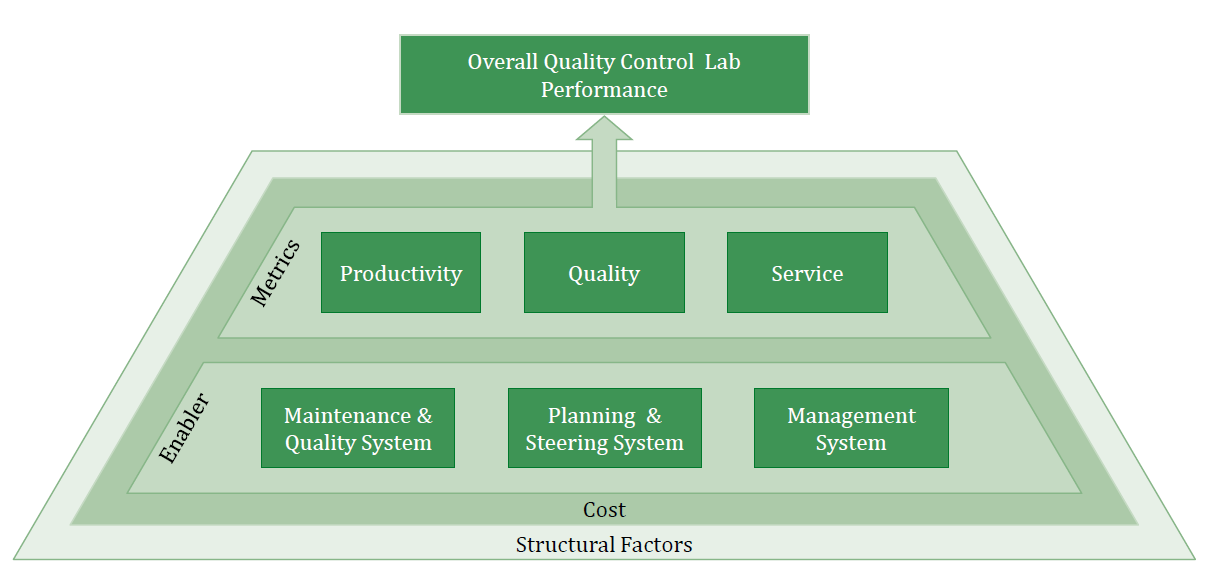
Benchmarking Approach
It is important that OPEX is not only measured by performance outcomes but also by analyzing how an organization achieves this performance. To bring performance outcomes and enabling factors together provides a comprehensive picture of your lab’s OPEX Performance and Maturity.
The QC Lab Benchmarking Model provides a structure for the benchmarking exercise. It encompasses a two-fold approach of Overall QC Lab Performance. The model comprises lab performance for the categories productivity, quality and service (top section). In addition, the enabler implementation level allows an assessment of the lab maturity (bottom section). Cost and structural factors provide an embedding in order to derive cost efficiency and to be able to compare similar labs to each other. Based on structural factors individual filters can be applied to build an individual peer group for the participant.
Productivity
The section of productivity metrics describe how efficient the lab is doing their job. Furthermore, insights on utilization and usage of synergy effects are disclosed.
Quality
The quality metrics section outlines how effective the lab is doing their job. Selected metrics allow to derive conclusions about the process and product quality.
Service
All service metrics enable to monitor both the lab processing speed as well as the adherence to the target schedule.
Key Performance Indices
Below a selection of KPIs is listed that is provided for every benchmarked lab within the comprehensive report. All KPIs that are marked with * are provided as overall KPIs as well as with a detailed split into further category (e.g. Drug Substance Tests/Drug Substance Direct QC FTEs). For a list with all KPIs and further information please contact us.
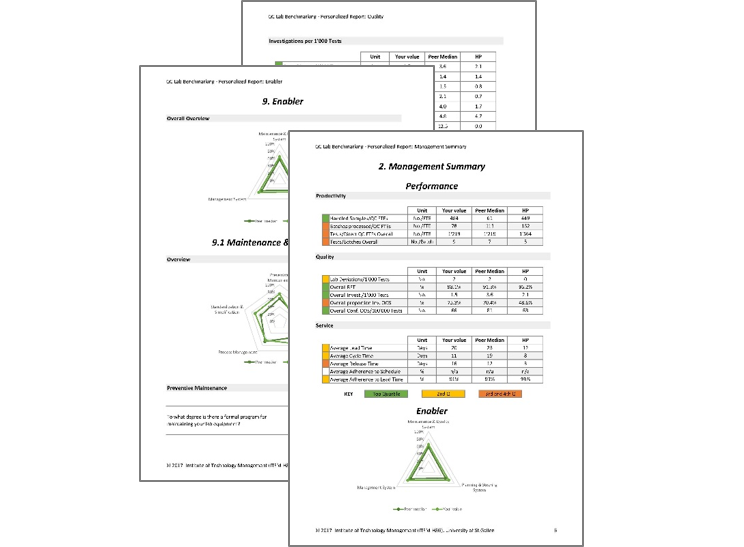
The comprehensive report allows to compare your lab with the relevant peer-group. A Management Summary will be provided that provides most relevant insights for Productivity, Quality and Service Performance and Enabler implementation level. Heat maps show your relative performance compared to the Top10% of labs in your peer-group. Furthermore, the peer-median value is provided for all KPIs an. Additional charts illustrated selected efficiency distributions (e.g. cost and headcount).
Granularity
The split into different testing categories in a comprehensive set of tasks performed (e.g. raw material testing) in a pharmaceutical quality control lab allows to build meaningful comparisons between labs with the same testing categories.
Determine Lab Productivity, Quality and Service Level
Compare your performance value for each category to the relevant peer-group. Gain insights on the peer-group median and the median of the Top10% for all KPIs.
Enabler Implementation Level
Degree of detail on the different fulfillment levels for each enabler ensures consistency. Furthermore, it provides a precise outline for participating companies on their operational excellence effort and activities in their lab.
Example Report
An extract of a personalized report is available. You can access the report here.